Optuna Your Model Hyperparameters

In machine learning, hyperparameter tuning is the effort of finding the optimal set of hyperparameter values for your model before the learning process begins. Optuna is an awesome open-source framework for automating this task. There are many other popular open-source hyperparameter optimization frameworks out there such as Hyperopt, Scikit-Optimize and Ray-Tune. What I love most about Optuna, though, is its overall ease of use and specifically its easy parallelization. In this article, we walk you through how to tune multiple models and run multiple Optuna trials all in parallel and from the same Jupyter notebook. You can follow along with Gretel.ai’s notebook located here.
Optuna Functionality
Optuna uses the notion of studies and trials. A study contains all the information surrounding the tuning of a specific model. A trial is a specific model training task trying out a specific set of model hyperparameters. Each trial calls the same objective function, which specifies the hyperparameters and their ranges that you’d like to tune and returns a value (such as model accuracy) that you’d like to optimize.
In our example notebook, we tuned multiple Gretel.ai synthetic models and optimized each using our Synthetic Quality Score (SQS). We then told Optuna to use an SQLite database (pre-packaged with most operating systems) to enable the running of multiple Optuna trials in parallel. Next, we placed the code to instantiate an Optuna trial in a Python module, which then enabled the Jupyter notebook to execute the module as many times in parallel as we’d like.
Below is the contents of our objective function:
Note how at the beginning of the objective function we use the trial.suggest* functions to specify which parameters we’d like to tune and over what values. The trial.suggest_int and trial.suggest_float will let you specify a range and then how you’d like to explore that range. The trial.suggest_categorical will let you specify a list of categorical values for Optuna to try. You can read more about these and other Optuna options here. After specifying which hyperparameters you’d like to tune, our objective function then trains a synthetic model, polls for completion and then returns our SQS score. This function exists in our external Python module, so we can run it multiple times.
In our main Jupyter notebook, we start by reading in the default synthetic configuration file, which contains all the default hyperparameter values needed to train a model:
We then create a function to instantiate an Optuna study:
The very first thing we do in the above function is instantiate a new Optuna study using “optuna.create_study”. This function takes as input the study name you’d like to use, a link to your SQLite database and whether you’d like to maximize the output of your objective function or minimize it. You don’t need to worry about creating the SQLite database, if it’s not there Optuna will create it. The function also optionally takes in a specification of which Optuna optimizer you’d like to use. If you’re just starting out, a good rule of thumb is to use the Random optimizer if you have a lot of computing resources, otherwise, the default TPE optimizer is a good option. You can read more about the optimizers available here.
Next, we use Optuna’s “study.enqueue_trial” method to tell Optuna to try the hyperparameters in our default configuration first. Oftentimes I’ll also queue up other configurations I’d like Optuna to specifically try as well. You can view Gretel’s recommended configurations for different dataset characteristics here. We then use “subprocess.Popen” to execute the Python module that will begin the Optuna trials. We repeat this for the number of trials we want to run in parallel, each time telling it how many trials each process should execute.
The main processing flow in our Jupyter notebook is then to read in the filenames of the datasets we’d like to tune models on, then call our above “create_study” function for each dataset:
We can then watch for study completion using this snippet of code:
The Jupyter notebook then contains some handy code for gathering all the Optuna results into one dataframe if you’d like to study the tuning history in-depth. You can refer to our notebook to see how this works.
Optuna Visualization
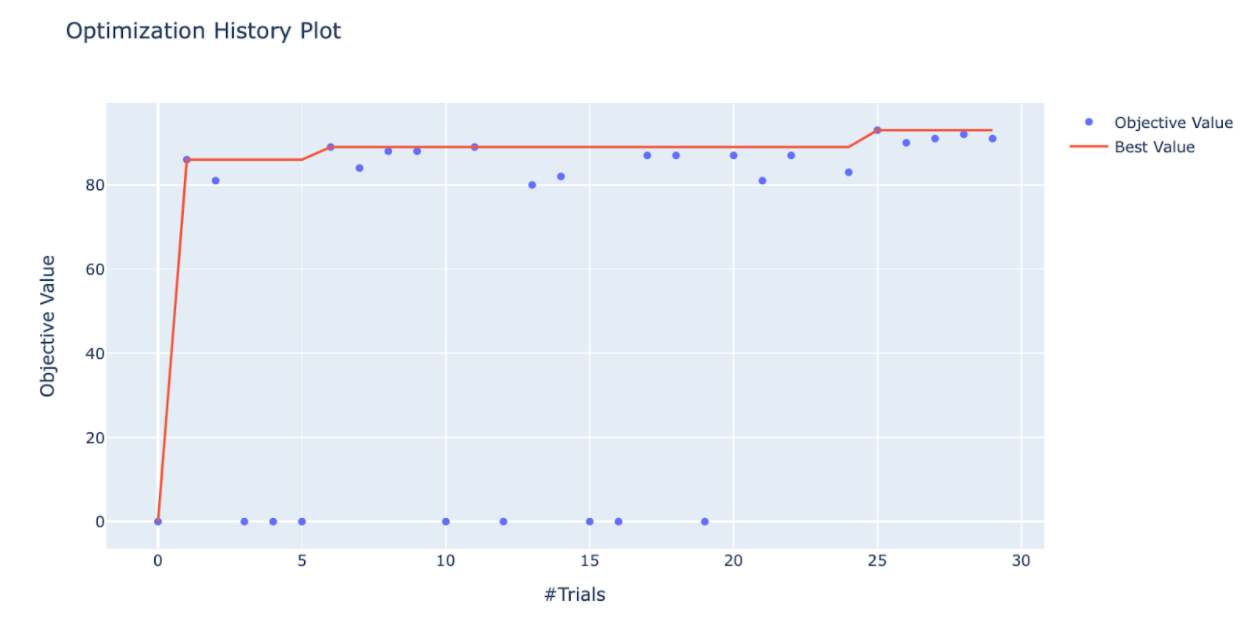
Optuna also contains a plethora of visualization routines to both monitor the progression of your tuning as well as assess the results upon completion. I like to use the “plot_optimization_history(study)” command to watch the optimization history of a study while waiting for it to complete.

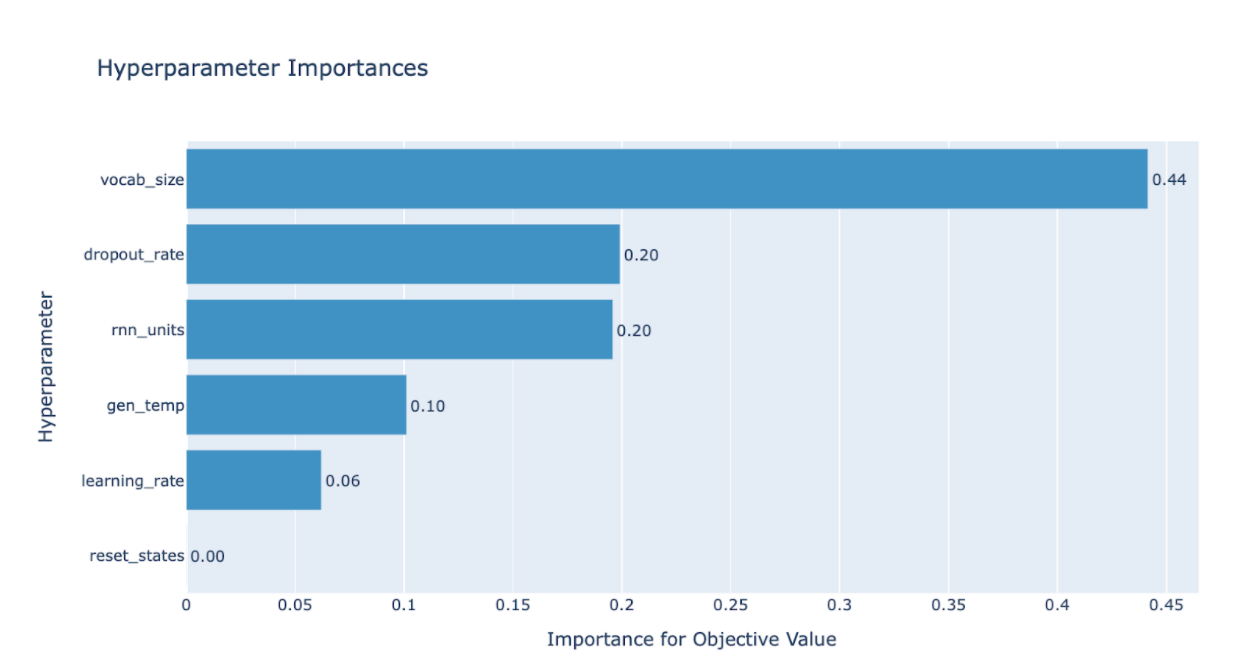
Upon completion, I usually first use the “plot_param_importances(study)” command to study which hyperparameters were most influential in the tuning.

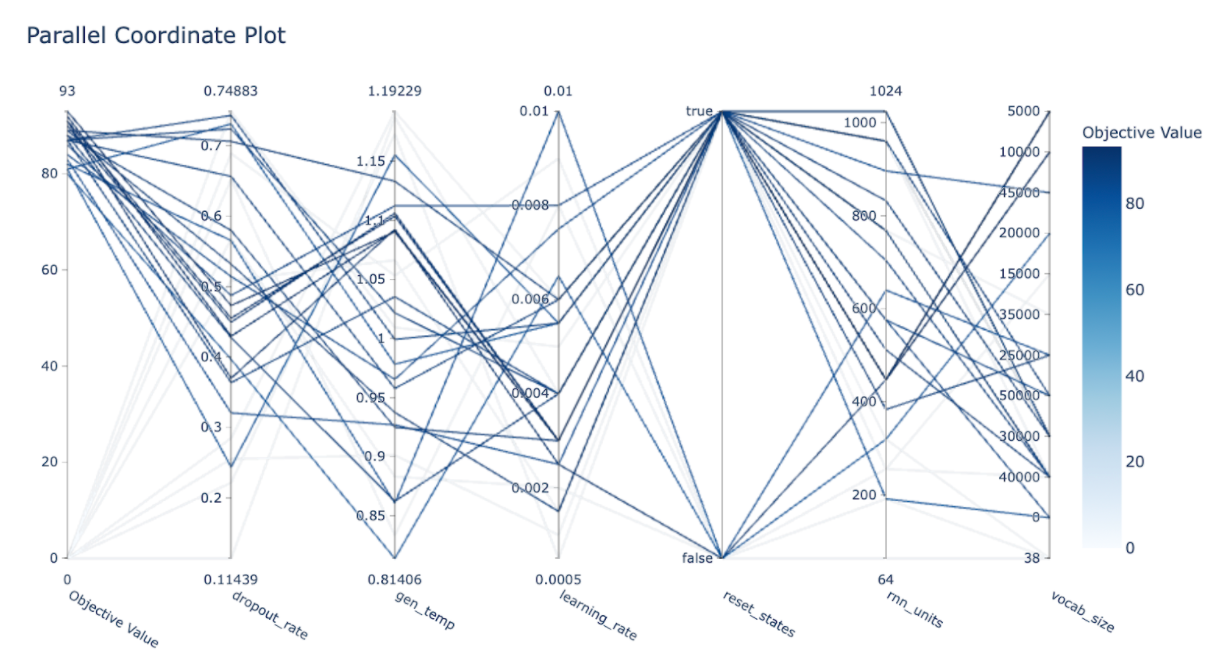
Another insightful graph is the parallel coordinates one using “plot_parallel_coordinate(study)”.

You can also use the “plot_slice(study)” command to view how each specific hyperparameter homed in on an optimal value, and the “plot_contour(study)” command to look at the relationship between hyperparameter values.
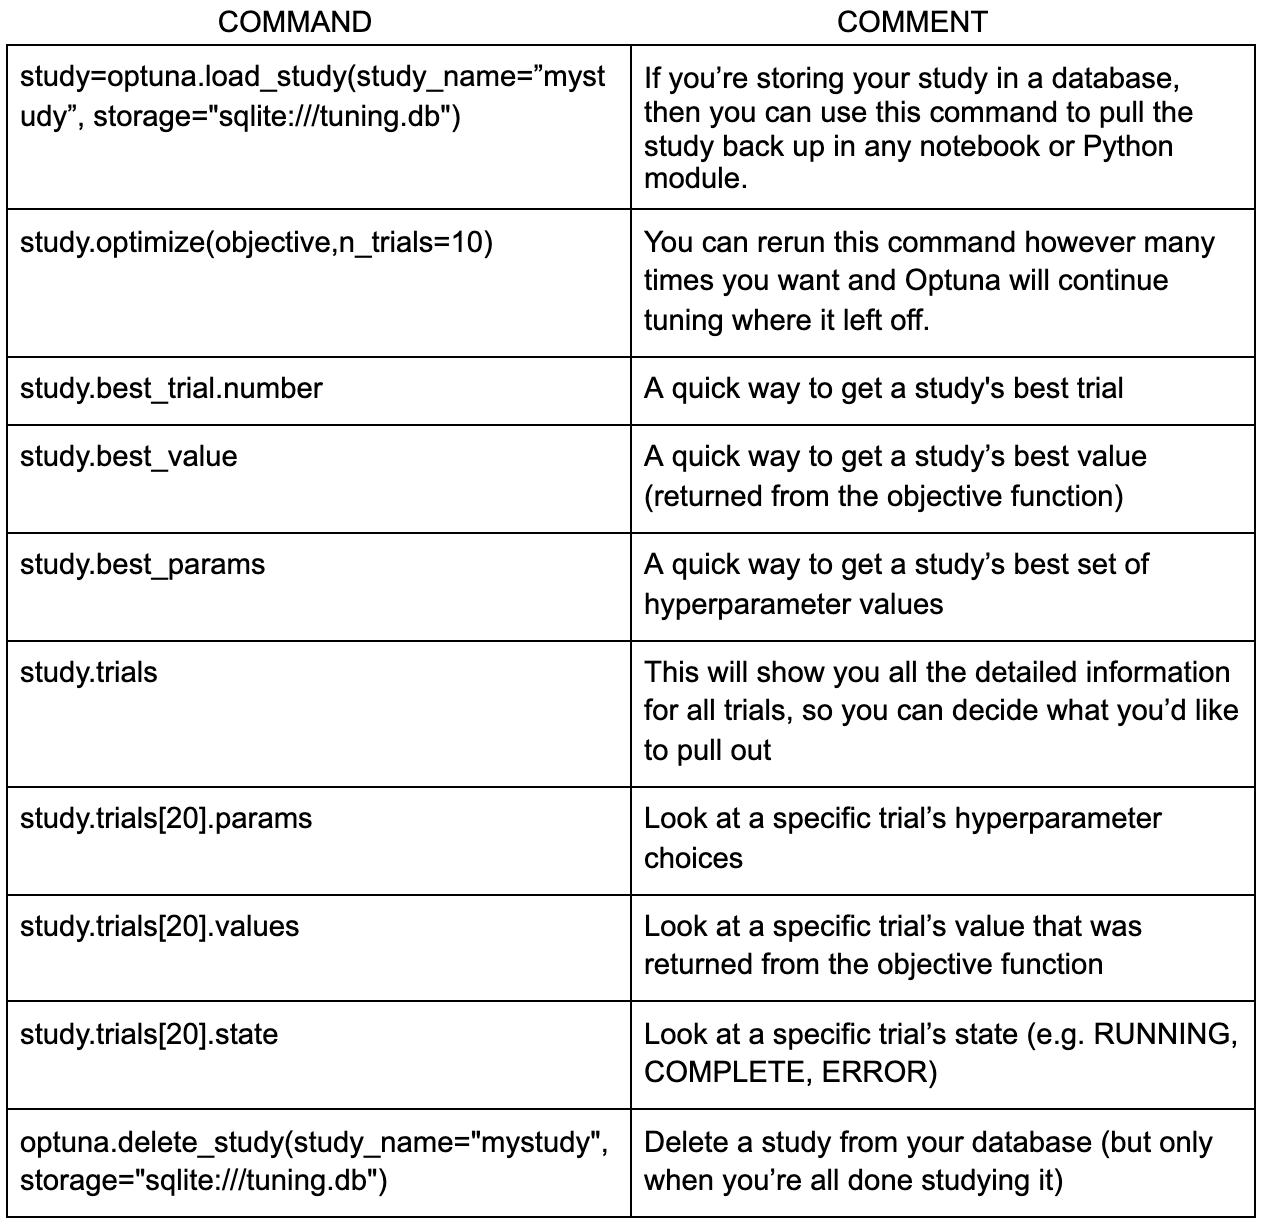
Handy Optuna Commands
There are a variety of handy Optuna commands I like to use either while a study is progressing or once it’s complete. Here are a few of my favorites:

Conclusion
Tuning a model’s hyperparameters can be a challenging and time-consuming process, yet often necessary if you want to build the most accurate model possible. Optuna is an easy to use and very effective framework for expediting this process. Here at Gretel, we have a series of preset hyperparameter configurations tuned for specific dataset characteristics. If you have an unusual dataset that doesn’t quite fit one of these configurations, or you’d like to make sure you’re building the best synthetic model possible, go ahead and give Optuna a try. It’s simple, fast, and very effective.
Please feel free to reach out to me at Gretel.ai with any questions. Thank you for reading!


