Instrumenting Kubernetes in AWS with Terraform and FluentBit
Productionizing Kubernetes presents a lot of challenges. The scale and diversity of jobs it is used to run is massive, which can make operationalization difficult. When (not if) something goes wrong, you need to be able to debug the issue, and fix it in a timely manner. Something that has made a huge difference for us at Gretel is the FluentBit project.
FluentBit is an open-source subproject of another project, Fluentd, which is developed and maintained under the Cloud Native Computing Foundation (CNCF) umbrella. Fluentd was developed to unify and simplify cloud logging infrastructure. FluentBit has a similar goal, but makes a few sacrifices in order to achieve a lot of the same functionality with a much smaller memory and CPU footprint.
Gretel utilizes FluentBit to collect logs and publish them to a storage and indexing service. Having all of the logs from our containerized workloads available and searchable makes many aspects of our operations simpler. We can create query based alerts, search for and debug issues, and watch trends in our infrastructure.
Setup
At Gretel, we use Terraform to provision our infrastructure, along with Helm to install and version a lot of our third party Kubernetes cluster tooling, including FluentBit. For the sake of this walkthrough, we will assume you are familiar with all of these. If you are not familiar with these tools, we have provided a little more background information, and a couple pointers, in the GitHub repository.
To get FluentBit up and running, most of the defaults in its Helm chart work perfectly. By default, the chart will create a Daemonset, as well as generate the necessary service account and role binding to make it work. We only need to provide basic information.
We can optionally create the namespace alongside the Helm release instead of specifying it as a separate Kubernetes resource. FluentBit should be deployed in its own namespace to allow for easier network segmentation, so this is a useful option for brevity:
Since the chart is going to create several resources in the process of deploying FluentBit, we’ll want to make sure we have the ‘cleanup_on_fail’ flag set in our Helm configuration, otherwise these resources will linger in our environment if FluentBit fails to be created for whatever reason.
Now, my personal preference is to do most of the modification and configuration of the Helm chart in a template YAML file that I reference from the helm_release resource above. This allows me to separate changes in versioning, or changes that may touch other infrastructure, from changes that are isolated to the application. Changes that are isolated to the application are hardcoded in the YAML, and changes that are not, are passed in for substitution.
Ok, now we are ready to start configuring the FluentBit application itself. First, we need to take care of a few small bookkeeping items. Namely, we want to set the version of the FluentBit image we want to use, and the Service Account we want the Daemonset to use. Since the image version is a ‘release’ change, and the service account used may impact other applications, I pass them in from Terraform, this way other infrastructure can be aware.
Terraform file:
Template file:
We now have a valid Helm release of FluentBit that we can deploy to our cluster!
It doesn’t necessarily do what we want quite yet, but this will run and generate logs (sent off to an elastic search instance that probably doesn’t exist) from a default configuration that FluentBit’s Helm Chart includes. You can check that Pods have been created on all your Nodes just by checking that the count matches your Node count.
If you notice that you have fewer Pods running than the number of Nodes in your cluster, you likely have Taints preventing them from being scheduled. If you want FluentBit to run on all of your Nodes, you can fix this by adding the ‘Tolerate Everything’ Toleration to the YAML file.
When checking the Pod count, there should now be a Pod for every Node. Now that we are able to get instances of FluentBit deployed onto our Nodes, let’s look at how we can configure it to capture the data we need, and send it where we need it.
Configuring the Pipeline
FluentBit uses a Pipeline model to process log data locally and ship it out to various destinations. The maintainers have provided a neat little graphic with the documentation that gives a great birds-eye-view of the stages.
The stages of a pipeline are organized with Tags. A Tag is a label that is attached to any piece of data, or Record, flowing through the pipeline. All pipeline stages before the Output stage have a `Tag` field, where you set the value for outgoing Records. Conversely, all pipeline stages after the Input stage have a `Match` field, which will only apply the stage to Records with a matching Tag. All Records have Tags, which tell you where the Record came from, enabling selective application of any stage in a given pipeline.
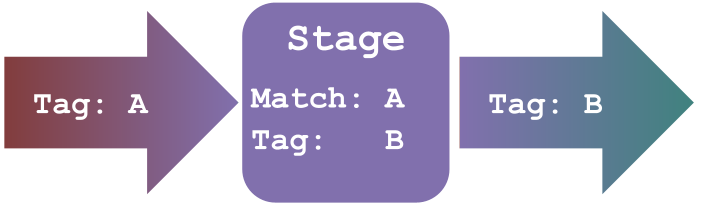
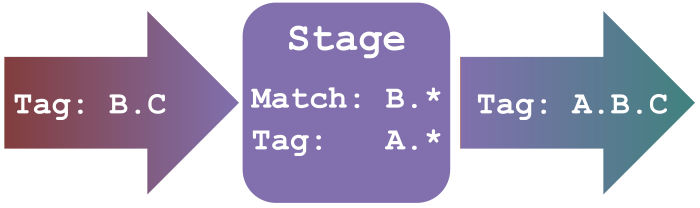
Both the `Tag` and `Match` fields can optionally make use of the wildcard operator (`*`).If used in the `Match` field, to select incoming data, the wildcard will match any subsequent value. If used in the `Tag` field, to set the value for outgoing data, the wildcard is replaced with the `Tag` the data had on its way into the stage.
Armed with our knowledge of Tags, we can now replace the default pipeline configuration with something more useful.
Inputs
The first stage needed in any pipeline is a set of Inputs. FluentBit provides several Input Plugins, but, for the sake of this walkthrough, we will focus on the Tail Plugin.
Tail allows us to read from files that are continuously appended to. At each call, it will read the tail of the file and provide any newly appended line as a Record to the pipeline. The only configuration required is the path(s) on the Node to read, and a Tag labeling our output.
For Kubernetes clusters using Docker as the container engine (pretty much all Kubernetes clusters), logs written to stdout or stderr by your application will be saved to files on the Node at:
This is because, by default, Docker uses the ‘json-file’ logging engine, which outputs container logs to a file under `containers/<container_name>.log`, and the Node’s Kubelet holds onto these log files for the duration of the Pod’s life in the var/log/ directory. Using this to define a Tail Input stage yields:
This will output lines written to files with the extension `.log` in the `var/log/containers/directory` as Records with the Tag `application.<prior_tag>`.
Something to look out for is that many of the Plugins come with pre-baked Tag values. For the Tail plugin, all data is initialized with a Tag specifying it’s filepath. This means that in our above input, all lines propagated to the pipeline as Records will have the tag
In addition to the basic fields needed to get Tails working, there are many optional fields which can modify its behavior and output. I recommend setting `Mem_Buf_Limit` and `Skip_Long_Lines`. `Mem_Buf_Limit` specifies the maximum amount of memory the Input can use when adding data to the pipeline, and `Skip_Long_Lines` tells the Plugin to skip any lines in the file that would run over that buffer size. Together the two options make FluentBit run more resiliently.
Parsers
Parsers allow us to structure the data produced by our Inputs so that they are more easily interpreted by later stages. FluentBit’s pipeline uses the JSON format to carry and process Records, so Parsers mainly exist to convert non-JSON data to JSON and to reformat and reorganize JSON fields.
The Parser we will focus on here is provided in the default parser configuration: docker.
The docker Parser provided is actually a specialization of the JSON parser, but it sets the time format used by docker, allowing it to be extracted and recognized by later stages. Using the docker parser, the Records output by the Tail plugin will have the log message, source stream, and time all separated into discrete fields of a JSON object.:
If the contents of your application logs are JSON, and you use the Docker container engine in your Kubernetes cluster, then adding `Parser docker` to your Input specification can improve both the performance of FluentBit (since some fields may be changed to a binary representation, reducing size), and assist in the readability of the logs you produce.
Filters
Filters play a dual role. They assist in formatting logs, making them more compact or more readable, much the same way Parsers do, but they can also append information to logs, providing context. For this walkthrough, I’m going to show an example of each.
To clean up our logs, we are going to use the Grep Filter. The Grep Filter, like its Unix counterpart, matches patterns. It allows you to include or exclude Records that match a regex, but only on a per-record basis. To keep a record that matches the regex in the output of the Filter, use the `Regex` field. To exclude a record that matches the regex in the Filter’s output, use the `Exclude` field.
Also, since logs are handled as JSON objects, the regex can be selectively applied to a single field in your data:
The Grep Filter is very handy when you are handling logs that are intended to be human readable. Such logs wind up with lots of extra empty log lines and superfluous syntax that isn’t very helpful when searching for the source of an issue.
To add some useful context to our logs, we can use the Kubernetes Filter. It allows you to pull information from Kubernetes and append it to all of the data flowing through the pipeline.
Configuring it is very similar to other pipeline stages, in that we name the Plugin, and provide both `Match` and `Tag` fields, but it additionally requires a way of extracting the Pod information from the Tag, and a source for the Kubernetes metadata.
The most straightforward way of setting this up, is to connect FluentBit to the Kube API by providing a URL and authentication values.
The set up of the `Kube_URL`, `Kube_CA_File`, `Kube_Token_File` values match how you would set up access to the Kubernetes API from a Pod here.
There are two potential pitfalls when using this plugin. The first is the source of information. If you have a large cluster that will be running many many instances of FluentBit, using the Kubernetes API as the source of metadata may overwhelm your network. In that scenario you should look into using the Kubelet as the source of metadata.
The second is, when accessing Kubernetes to get the metadata to append, the plugin uses the Pod information from the Record’s Tag to look it up. If the Tag has the prefix kube then it will by default strip off that prefix and use what follows as the pod information. For instance, if a Record’s Tag is `kube.default.app-xyz` then the plugin will look up Namespace: default Pod: app-xyz in the API and append the resulting information. If you aren’t prefixing your Record Tags with `kube`, or the Pod information does not follow it, you’ll need to set the `Kube_Tag_Prefix` or `Regex_Parser` field so that the plugin can extract the Pod information from the Tag.
Output
Now that we have a pipeline capable of producing logs we want, we need to exfiltrate those logs to be stored and indexed for later searching. In this guide we will focus on using Amazon’s Cloudwatch service.
In order to be able to send out logs to cloudwatch we need to be sure of two things. First, that our Nodes have the needed network access, and second, that our Nodes have the needed permission in our target log retention service. Since we are using AWS EKS as our Kubernetes platform, we need to make sure our VPC configuration allows the network traffic we need, and our IAM configuration gives us the application permissions we need.
Now, it’s nearly impossible for this walkthrough to tell you how to set up your VPC, or in general how to organize and segment your network. That would be an entire book. Instead I’ll just point out that unless you have specifically disable network access from your Nodes, then those permissions should be in place. If you have however instituted network segmentation in your infrastructure, you’ll need to modify it to allow communication from the Nodes to Cloudwatch.
Fortunately, from the IAM side things are a little more cut and dry. AWS has a walkthrough on setting up the needed permissions. Assuming you have an IAM role for your EKS Nodes, you can simply add a new Policy to the role in the Terraform file. This will give your Node the new permissions :
Now, the `CloudWatchAgentServerPolicy` attached here, that Amazon provides, may be more permissive than you want, so feel free to create a new policy in IAM that only includes permission for Cloudwatch log operations.
Once our Node permissions are updated, we can include the `cloudwatch_logs` Output Plugin in our pipeline, and we should see the results of our pipeline in Cloudwatch.
One thing to pay particular attention to is that the `Region` in the config matches the region where your EKS cluster is running. Cross region network traffic can be expensive, so here I’ve templated out the region field to match the region specified in the Terraform file, ensuring we won’t be eating a bunch of network costs:
Now we have everything in place to collect logs from applications operating in our Kubernetes cluster, tagged with all of the source information you may need to debug problems. In the GitHub repository we’ve gone a step further and set this up on an AWS EKS cluster so you can watch it in action. Head on over there and check it out.
%20(1).png)