Evaluating Data Sampling Methods with a Synthetic Quality Score

Introduction
While much recent research in probabilistic generative modeling has focused on visual domains such as images, a large portion of synthetic data use cases revolve around structured data such as CSVs and Databases. At Gretel, we have built generative modeling tools to learn distributions from customer data and generate realistic synthetic data from those distributions.
As with any ML project, a key aspect is measuring a model’s performance. We have developed a tool called the Synthetic Quality Score (SQS) to ensure that the tabular output of our generative models maintains important statistical information found in the ground-truth data. In this post, we'll walkthrough the process of how we calculate and interpret our synthetic quality score, and how you can use it to evaluate the effect that sampling methods have on the quality of synthetically-generated tabular data.
Calculating Gretel's Synthetic Quality Score (SQS)
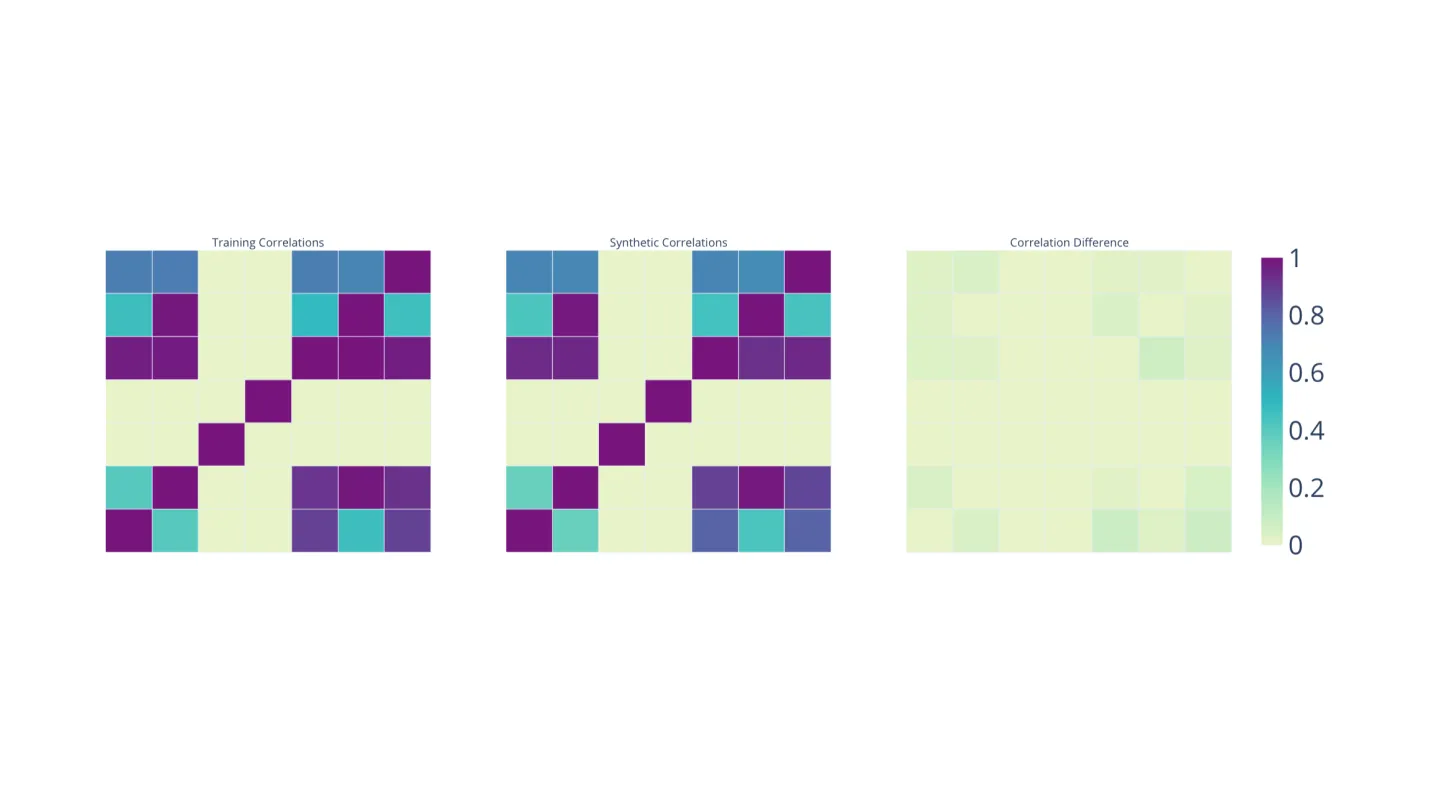
To calculate a synthetic quality score, we first measure the inter-columnar correlations of the ground-truth dataset and the synthetic dataset. We then look at the directions of greatest variance, as measured by the principal component analyses. We finally observe the discrete mass distributions of each feature in the dataset.


The SQS Formula
Using the distances between correlation values, PCAs, and feature distributions we construct a single scalar for each of the three features above. These real scalar values are in the range [0,100] and are smooth. These two properties are ensured by fitting polynomials over a large number of real tabular datasets. The SQS is then calculated and normalized. An SQS of 100 means the synthetic data is a perfect match and 0 means the model fit was quite poor.

Evaluating Different Sampling Methods Using SQS
With this measure in place we can now explore how probabilistic sampling can change the quality of synthetically generated data. We use a decoder only Transformer with 1.5 billion parameters fine tuned on the UCI Adult dataset.
The Transformer is trained to model a categorical distribution over a finite vocabulary. The vocabulary consists of encoding tokens of the dataset. There are many ways to sample from this distribution over the vocabulary. The first is to directly sample from the temperature adjusted distribution which performs very well due to the alignment between training and testing. Alternatively we can restrict the categorical distribution to the top k tokens or the nucleus of top p mass or to the set of tokens with high typical information content. These methods perform slightly worse, which is surprising given their prevalence in many NLP generative modeling tasks. Worse of all is beam search, which likely fails due to the sharpness of the categorical distribution.
Our method of choice is an ensemble of sampling methods which performs as well as sampling directly from the categorical distribution while reducing the variance of SQS performance.

Conclusion
With the help of our synthetic quality score, we looked at the performance of various data sampling methods and how they can impact the quality of generated data. This is an interesting avenue into analyzing data quality, and one we will be exploring more in the future. If you want to learn more about our scoring system or our synthetic data quality reports, check out this post. Also, feel free to reach out at hi@gretel.ai or join and share your ideas in our Slack community.


